Hypothesis Testing in Statistic Assignment Help
Are you looking for Hypothesis Testing in Statistic Assignment Questions and Answers Help? We are providing the best Statistic Assignment Sample at the best Price with unique work at Assignmenthelpaus.com. Our assignment writers provide you MBA assignment services with 100% plagiarism-free content. If you need Hypothesis Testing in Statistic Assignment Help so, place your order now!

Assignment Details:
- Words: 1000
Hypothesis Testing: Questions and Answers
Write your answers after each question
Define the following terms: 1 mark each
- A Hypothesis
- A Null Hypothesis
- The critical value
- The test statistic
Questions to answer 2 marks each except for B and H
- What do we call either 95% or 99% when we conduct a hypothesis test?
- What do we look up z tables or t tables to find? 1 mark
- If the answer to the test statistic is > the critical value, do we accept or reject the null hypothesis?
- When is a t test used instead of a z test formula to find the test statistic?
- When do we us the t formulae to calculate the test statistic instead of the z formula?
- What is a type 2 error, and how can it be fixed, or can the error be not made?
- What do you want to find out when you use a two-tail hypothesis test? 1 mark
Regression: Questions and Answers
Write your answers after each question
Define the following terms: 1 mark each
- Correlation
- Quantitative variable
- A positive relationship between X and Y
- An error term in a regression equation
Questions the following questions
The following is the printout from a regression model which is testing the relationship between the number of fish meals per week and the amount of mercury in the blood of the people who have eaten the fish.
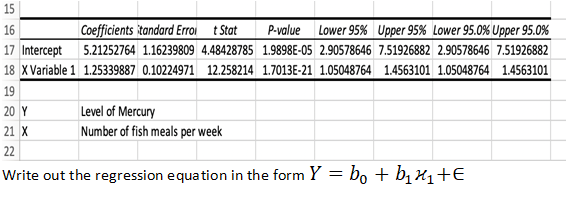
This is information from the same regression Fish eating and mercury in blood
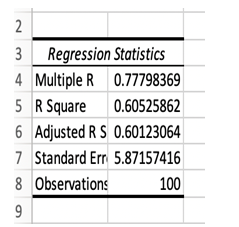
1. What does R square or R2 show in general?
2. What value of R square is ideal?
3. What does the value here above tell us about what percentage of the Y variable is explained by the X variable?
4. What would we need to do to increase the value of the R square? Add more observations or increase the number of X variables?
For REF… Use: #getanswers2002223