STT100 Statistics for Business Assessment Solutions

STEP 1.- Use calculator soup after selecting your data to find the key statistics- sample size, mean & standard deviation
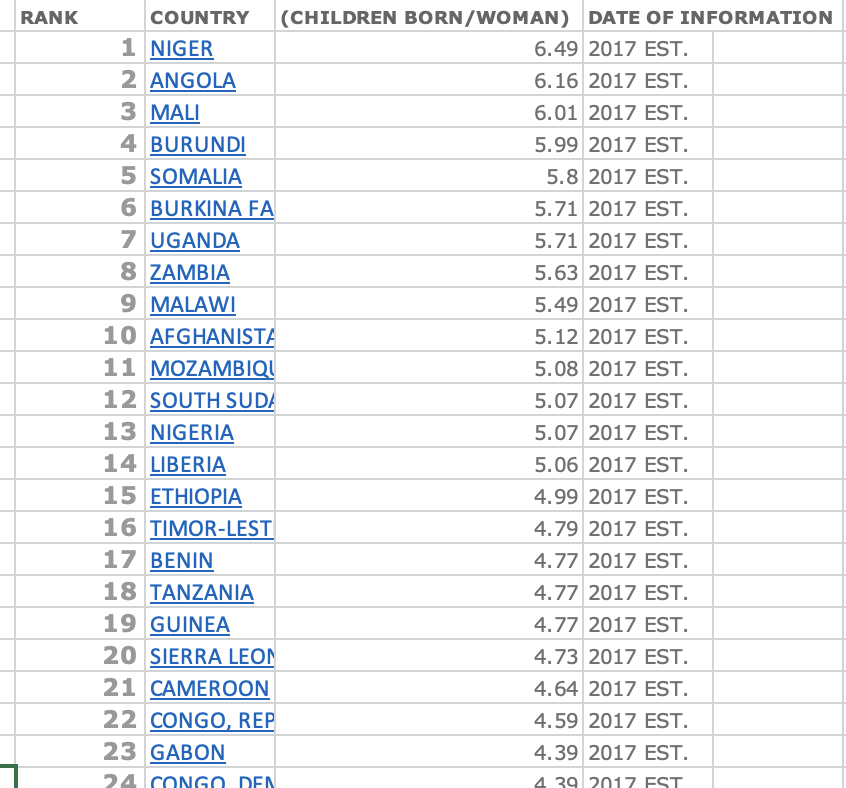
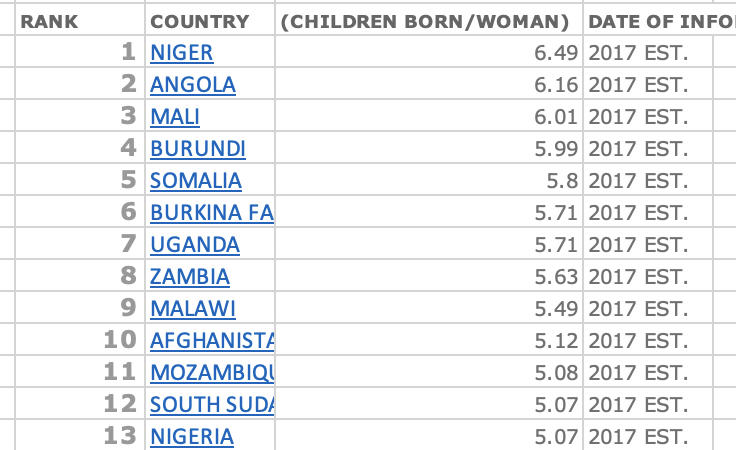
1. Number of children per woman per country (you can select this but select another country other than INDIA)
(a) Use the following link
https://en.wikipedia.org/wiki/List_of_sovereign_states_and_dependencies_by_total_fertility_rate copy data into an excel file
(b) Copy into an excel file and past it into the following online calculator soup statistical tool to calculate the mean and standard deviation of the median ages of all countries;
http://www.calculatorsoup.com/calculators/statistics/descriptivestatistics.php
Your result will look like this (with different numbers):..you will need the mean and standard deviation to complete the test statistic see later)
Calculator soup uses the raw data and gives you numbers that you need to calculate your test statistic:
This includes :
- The average for all countries
- The country with the highest value
- The country with the lowest value
- N -the sample size (The total number of countries0
- The standard deviation
For my data:
- x¯average = 2.52892857143
- Minimum min = 0.83
- Maximum max = 6.49
- n = 224
- Standard Deviation s = 1.20507027288
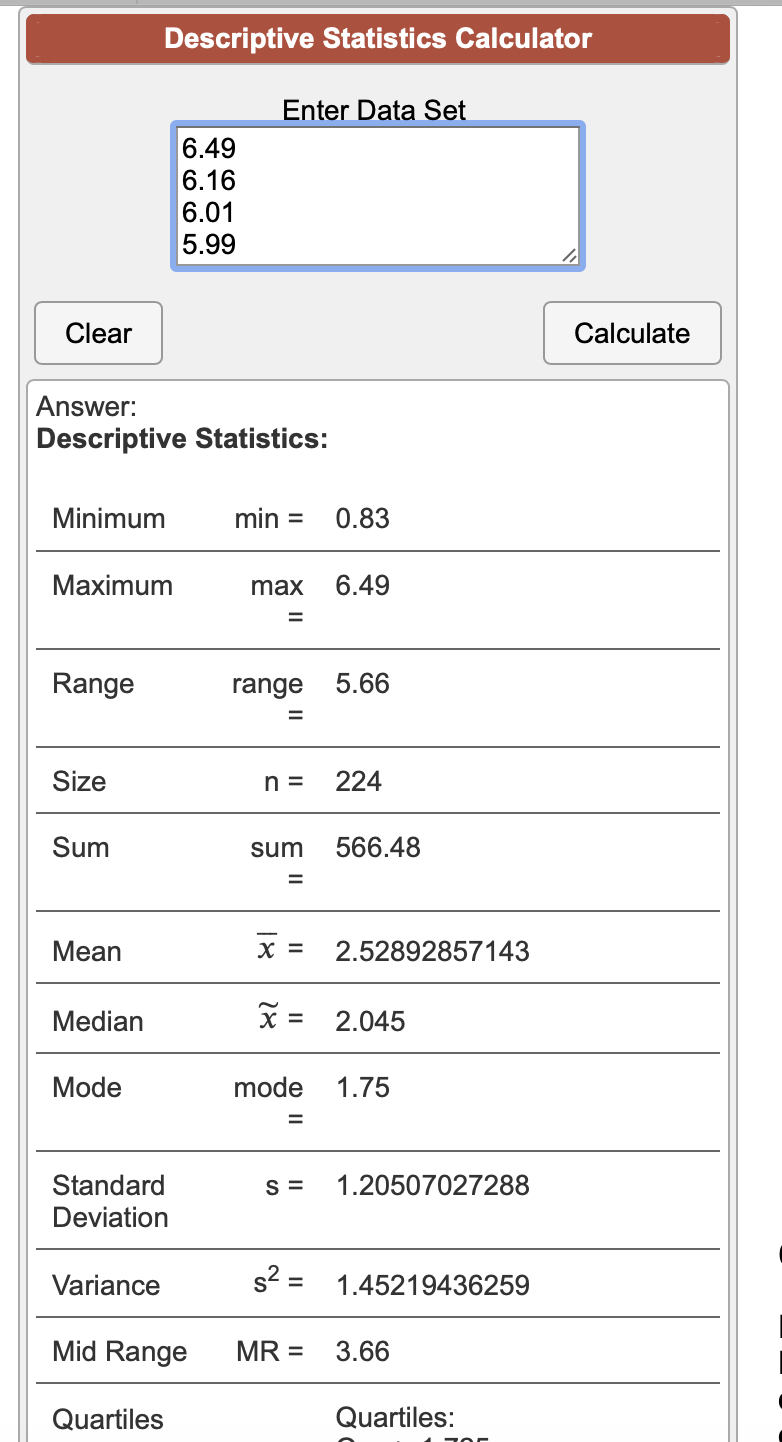
Take a screen shot of your statistics like this and include in your assignment.
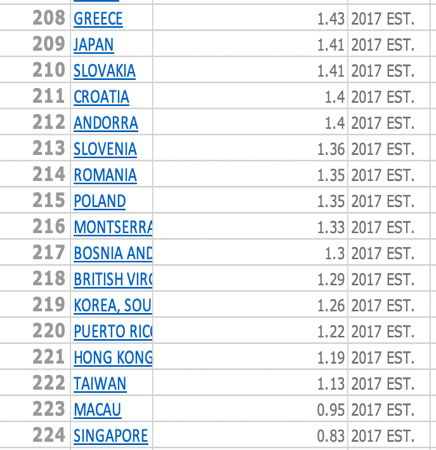
(c) Select a country with a number of children per woman.
The result will be better if you select a country with either:
- A high number of children per woman or
- A low number of children per woman
And one that is high
And one that is low
The aim of the assignment is to conclude a hypothesis that STATISTICALLY the country selected is significantly higher or lower than the world average
STEP 2.- Here you are drawing statistical conclusions about the selected country.
Conduct a Hypothesis test using the following STEPS:
1. State the Null hypothesis (Ho) (it is not statistically different So Ho=0) and the Alternative hypothesis (HA) (it is statically different). Ha ≠ 0
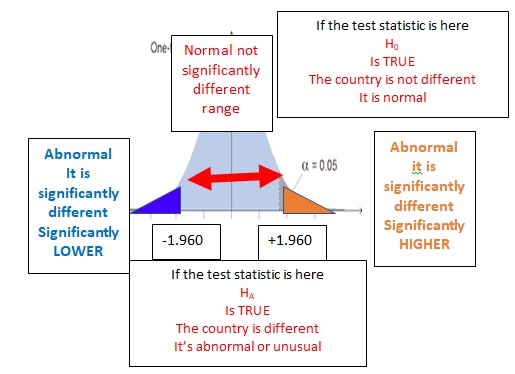
2. Choose the level of significance. This either sets the normal range before the tails where it is not normal to be either 95% or 99% of the normal curve.
3. Find the critical value. This is the cut-off point on the normal curve in standard deviations between the Null (normal) not different and the alternative (in the tails of the normal curve) that it is significantly different. The critical value is found in statistical tables 95% =1.960 1.960 is the critical cut off value. YOU WILL ALL USE THIS
4. Find the test statistic. This calculated using ( A FORMULAE) with the X value for the country selected the average for all countries and the standard deviation using the data for all countries. The result of this calculation will be in standard deviations (Z Score) which will place the country selected in the normal range or the abnormal range of the normal curve. If the test statistic is < +1.960 or > -1.960 this country is normal & not significantly different to the average for all countries BUT IF the test statistic > 1.960 + then this country is significantly higher than the average for all countries And, if the test statistic is > 1.960 – then this country is significantly lower than the average for all countries
The normal curve below could be used to illustrate the cut off critical vales etc.
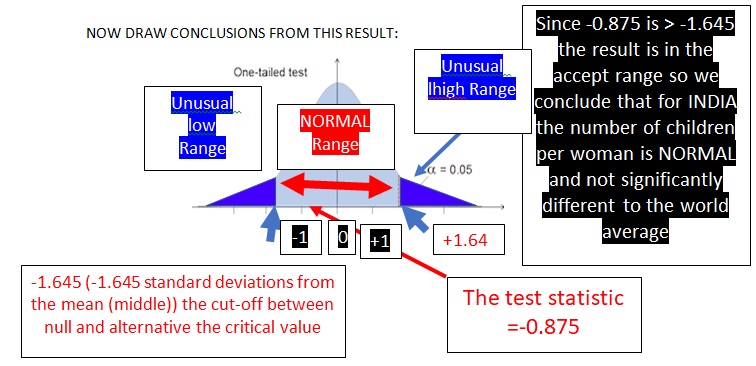
STEP 3.- Draw a STATISTICAL CONCLUSIONS.
ONLY TWO CONCLUSIONS EXIST:
- YES, this country is significantly statistically different to the average for all countries.
- No, it is in the normal range and so it is NOT significantly statistically different to the average for all countries.
If Astra Seneca when it tested it Covid vaccine on a sample group of 3000 people it would give a placebo vaccine to 15000 and the real vaccine to the other 1500. Then it would use statistics to find if the group given the real vaccine hade significantly less symptoms of covid (maybe no symptoms) than the placebo group.
STEP.4 – Analyse and explain the causes and consequences of your selected country being normal or unusual as far as its outcome compared with the world average.
Draw an analytical written conclusions.
You must use referenced research to find out details about:
- WHY the country that you have considered is different or similar to the world average. What are the special reasons for this?
- What are the consequences and effects and costs (or benefits) for this country in having this difference or lack of difference?
- What government or social policies might be used to correct the factors that are causing this difference. Alternatively what are the consequences of its results being normal. Consider what other countries have done and make suggestions for this country based on what they have done.
- What other changes might this difference cause or what other changes might correct this difference? Why might it restrict this, countries? Or if not different what benefits are there for this country in being normal.
Are you finding STT100 Statistics for Business Assessment Answers? We have a team of eminent writers who assist you with Business Assignment Help Services at a cost-effective price. Students can avail of any of our academic writing services with 100% original content writing. Assignmenthelpaus.com delivers plagiarism free work by expert tutors.
For REF… Use: #getanswers2002195 D