Maths and Business Finance Assessment Brief
Are you looking for Maths and Business Finance Assessment Answers to Questions? Reduce your stress by taking Finance Assignment Help from experienced & reliable writers. Assignmenthelpaus.com provides you with Coursework Assignment Help at a cost-effective price. You can avail of our finance assignment sample that is authentic to the core. Boost your grade with Assignment Help AUS.

Assessment Brief
You work as a financial analyst at a consultancy firm. The director of finance has been pleased with your work and is looking to assign you more responsibilities. He has asked you to complete a series of tasks to test what you can do.
Task 1
(a) 1. Sarah decides to invest £22,500 at 3.55% compound interest for 5 years. What will be the value of the investment after three years? Please give your answer to TWO decimal places.
2. Nidzam Traders Ltd receives £119,300 after investing for 3 years at an annual interest rate of 4.68%. What was the original amount the company invested? Please give your answer to TWO decimal places.
3. Haresh invests £17,565 and after 8 years he receives £76,300. The interest rates the bank applied to the deposit changed each year. Using the geometric mean method, calculate the average annual interest rate. Please give your answer to TWO decimal places.
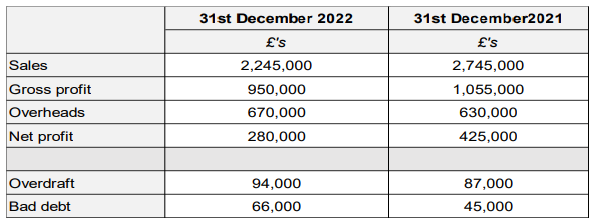
(b) Allied National Bank is deciding whether to grant a loan application to a new As part of the analysis, calculate the percentage change for each of the headline numbers on the table below. Please give your answers to TWO decimal places.
(c) The government has released the latest consumer price index (CPI) which suggests inflation was 3.1%. A typical basket of food at the supermarket this week costs £77.84. Calculate the cost of that typical basket to TWO decimal places:
- one year ago
- one month ago (assuming inflation occurs evenly throughout the year)
Task 2
(a) A car showroom has ordered the following makes of car over the last year from various manufacturers:
| 14,070 BMW 3 Series costing a total of £633,150,000 |
| 23,500 VW Golf costing a total of £634,500,000 |
| 4,670 Renault Espace costing £19,500 each |
A new supplier has approached them offering them the same makes of car at 34% less than the overall average price per unit they paid in the previous year. To TWO decimal places, what will be the average price per car charged by the new supplier?
(b) Expand and simplify the following expression:
(7a – 4b) (3a + 6b)
(c) Factorise the following expression: 33p3q2 + 3p2q3 – 117pq
Task 3
(a) Using the Excel functionality, calculate the following statistics:
- Highest, lowest and range of marks
- The mode of the sample
- The median of the sample
- The mean of the sample
- The standard deviation of the sample
(b) Aggregate this data into a suitable frequency table using the COUNTIFS function and using an interval of 10.
(c) Plot a histogram of the data.
(d) The Head of the Modern Languages programme is worried that the many of students have not passed the exam. He is also anxious that the majority have not achieved grades above a target mark of 55%. Using the data you have found, explain if he is right to be concerned and why.
Task 4
Adventure holiday company Xtreme Trek offers tourists hiking holidays in the UK, offering two destinations: trekking in the Scottish Highlands or walking in the Yorkshire Dales. The manager of Xtreme Trek has produced the following table to show the bookings he received last summer:
| Type of Booking | ||
| Tourist’s home country | Scottish Highlands |
Yorkshire Dales |
| France | 130 | 46 |
| Italy | 34 | 65 |
| USA | 103 | 77 |
| Canada | 98 | 143 |
Using the data is also provided in the “MBF Summative data.xlsx” file under the “Task 4 – Data” tab:
(a) Produce a horizontal stacked bar chart to show the number of bookings by home country and type of booking.
(b) Produce a pie chart to show the number of bookings as a whole by home Ensure the data labels on the pie chart are expressed in percentage to TWO decimal places.
(c) From the data gathered, interpret your results.