FMA 101 Topic 8 – Capital Budgeting Techniques Assignment Answers
If you need any kind of help in FMA 101 Financial Management TOPIC 8 – Capital Budgeting Techniques Assignment, then AssignmentHelpAUS can help you. We guarantee 100% plagiarism free work and all credit goes to our expert writers. Students can contact us at any time. We provide service on Dissertation Writing Help, Essay Writing and MBA Assignment Help etc. Contact us now for more inquiry related to Online Assignment Help.

FMA 101 Topic 8 LEARNING OUTCOMES
After completing this topic, you should be able to:
- Explain and discuss the role and purpose of capital
- Evaluate, explain, discuss and apply a variety of capital budgeting techniques to evaluate capital investment proposals and make investment
- Compare NPV and IRR in terms of net present value profiles and conflicting rankings, and explain the theoretical and practical strengths of each approach.
FMA 101 READING Topic 8 :
Before continuing with this topic, please read the following:
- Gitman et al. (2015: Chapter 10)
Please make sure that you also read this study guide carefully as it contains additional information that is not in the prescribed textbook.
The FMA 101 key concepts that you must focus on are:
- Capital budgeting
- Motives for capital expenditure
- The steps in a capital budgeting process
- Independent versus mutually exclusive projects
- Unlimited funds versus capital rationing
- Accept–reject versus ranking decisions
Before you can apply the different capital budgeting techniques used for purposes of capital budgeting and capital investment decisions, you need to have a very good understanding of the role and purpose of a capital budget.
You need to be able to explain this role and purpose and you also need to be able to list and discuss the reasons why entities prepare capital budgets and the process that they follow when preparing such budgets.
You need to be able to distinguish between independent and mutually exclusive projects and you need to know the difference between having unlimited funds and having to apply capital rationing.
It is also very important for you to understand and be able to apply the accept– reject and the ranking approaches when having to make capital investment decisions.
OVERVIEW OF CAPITAL BUDGETING TECHNIQUES
The key concepts that you must focus on are:
- Present value and net present value
- Payback period method
- Net present value (NPV) method
- Internal rate of return (IRR) method
A business entity would want to make the best possible decisions when considering major capital expenditure. Financial managers would want to spend money on those capital opportunities that are going to provide the highest possible returns on the investments made at the lowest possible cost and that will contribute to maximising the wealth of the owners, the value of the business and benefits for communities.
However, they need tools to assist them with such decisions. Financial managers use three popular capital budgeting techniques to make such decisions. These techniques are:
- payback period method (basic and unsophisticated)
- net present value (NPV) method – sophisticated
- internal rate of return (IRR) method – sophisticated
CALCULATING THE PRESENT VALUE AND NET PRESENT VALUE
Calculating a present value
The present value of a cash-flow amount is the current value of the cash-flow amount after having discounted the cash-flow amount at a particular discount rate, for example 15%.
Example:
- Cash-flow amount = R20 000 received two years from today
- Discount rate = 15%
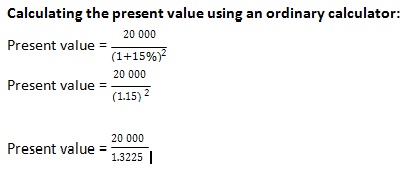
Present value = 15 123 (rounded off to the nearest whole number)
Calculating the present value using the present value interest factor tables (Appendix A in prescribed textbook, Annexure B in study guide):
Present value = 20 000 × PVIF15%, 2
Present value = 20 000 × 0.756
Present value = 15 120
Calculating a net present value
The net present value of a set of cash flows is the difference between the sum of the present values of the cash flows and the initial investment amount.
Example:
- The total present values of a set of cash flows = R123 500
- Initial investment amount = R100 000
- Net present value = R123 500 – R100 000 = R23 500
PAYBACK PERIOD METHOD
You must be able to describe and explain the payback period method regarding:
- its purpose and function
- how decisions are made using this method
- advantages and disadvantages
You must also be able to use information provided for different scenarios to calculate payback periods and interpret the results to make recommendations or decisions.
Study Example 10.3 and Tables 10.2 and 10.3 that explain and demonstrate how the payback period is applied in order to make a capital investment decision.
FMA 101 NET PRESENT VALUE (NPV) METHOD
You must be able to describe and explain the net present value method concerning:
- its purpose and function
- making decisions when applying this method
The following example demonstrates how to calculate the NPVs of two different projects using the Present Value table (Table A-2 included in Appendix A in the prescribed textbook and Annexure B in this study guide). The amounts shown are net cash-flow amounts. This means taking into account both cash inflows and cash outflows for every year and using the net cash flow (cash inflows – cash outflows) per year. The initial cash investment amount is R1 000 in Year 1 and the expected rate of return on investment (WACC) is 10% per annum.
| Year | Project A
(Rand) |
Project B
(Rand) |
| 1 | 500 | 100 |
| 2 | 400 | 200 |
| 3 | 300 | 300 |
| 4 | 100 | 400 |
| 5 | 10 | 500 |
| 6 | 10 | 600 |
Table 8.1 Net cash flows
| Year | Net cash flow | PVIF 10% | PV of cash flow | Net cash flow | PVIF 10% | PV of cash flow | |
| 1 | 500 | 0.909 | 455 | 100 | 0.909 | 91 | |
| 2 | 400 | 0.826 | 330 | 200 | 0.826 | 165 | |
| 3 | 300 | 0.751 | 225 | 300 | 0.751 | 225 | |
| 4 | 100 | 0.683 | 68 | 400 | 0.683 | 273 | |
| 5 | 10 | 0.621 | 6 | 500 | 0.621 | 311 | |
| 6 | 10 | 0.564 | 6 | 600 | 0.564 | 338 |
| Present value = | 1 090 | Present value = | 1 403 |
| Less Investment | 1 000 | Less Investment | 1 000 |
| Net present value = | 90 | Net present value = | 403 |
Decision:
- Both projects have a positive NPV (NPV > 0).
- NPV of Project B is greater than the NPV of Project A (NPVB > NPVA).
- Select Project B as it has the higher positive
INTERNAL RATE OF RETURN (IRR) METHOD
You must be able to discuss and explain the internal rate of return method concerning:
- its purpose and function
- making decisions when using this method
- the IRR calculated by the “trial-and-error” method
Applying the “trial-and-error” method to calculate the IRR
- The method is a trial-and-error method because you will need to “guess” one of the discount rates and continue guessing discount rates until you find a suitable discount rate, as explained below.
- To calculate the IRR using this method the same set of cash flows is used to calculate:
- TWO sets of present values using two different discount rates
- TWO net present values, one a POSITIVE NPV and the other a NEGATIVE NPV
- The one net present value must be POSITIVE and the other net present value must be NEGATIVE. The reason for this is that the IRR is the rate of return that causes the NPV of a set of cash flows to be equal to nil (NPV = 0). Having an NPV > 0 and an NPV < 0, means that the true IRR must have a value somewhere between the discount rate used to calculate the positive NPV and the discount rate used to calculate the negative NVP.
- If the first discount rate used is low, for example 8%, and it results in a positive NPV, then use a much higher discount rate, for example 20%, when “guessing” the second discount rate, as this will most probably result in the second NPV being negative.
- Alternatively, if the first discount rate is high, for example 20%, and the resultant NPV is positive, then you should select a second, much lower discount rate, for example 5%. This should then result in the second NPV being negative.
Table 8.2 below demonstrates the trial-and-error method using two projects, A and B, an initial rate of return (discount rate) of 10% for both projects and an alternative and much higher discount rate of 20% as the alternative discount rate.
Table 8.2 Net present values for projects A and B
|
Year |
PVIF10%, 1-6 |
PV
Project A @ 10% |
PV
Project B @ 10% |
PVIF20%, 1-6 |
PV
Project A @ 20% |
PV
Project B @ 20% |
| 1 | 0.909 | 455 | 91 | 0.833 | 417 | 83 |
| 2 | 0.826 | 330 | 165 | 0.694 | 278 | 139 |
| 3 | 0.751 | 225 | 225 | 0.579 | 174 | 174 |
| 4 | 0.683 | 68 | 273 | 0.482 | 48 | 193 |
| 5 | 0.621 | 6 | 311 | 0.402 | 4 | 201 |
| 6 | 0.564 | 6 | 338 | 0.335 | 3 | 201 |
| PV = | 1 090 | 1 403 | PV = | 924 | 991 | |
| Investment | 1 000 | 1 000 | Investment | 1 000 | 1 000 | |
| NPV = | 90 | 403 | NPV = | (76) | (9) |
As demonstrated in Table 8.2, calculating the NPVs for projects A and B using a discount rate of 10% results in both projects having positive NPV values, NPVA = R90 and NPVB = R403.
A second and much higher discount rate (20%) is now “guessed” and used to calculate the second set of NPV values for projects A and B. These calculations are also included in Table 8.2. At a discount rate of 20%, both projects now have negative NPVs, NPVA = (R76) and NPVB = (R9).
To determine the “true” IRR that will equate the NPV of a project to its original investment value will require some additional calculations.
To calculate the actual IRR for each of the projects, the following method is used:

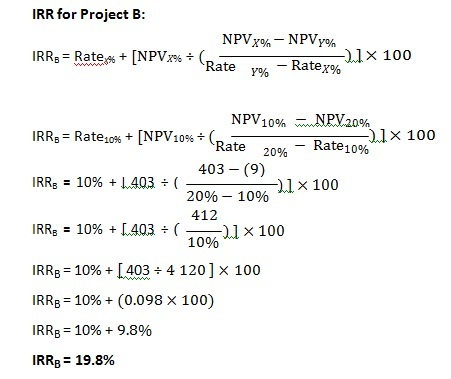
Decision:
The IRRs of both projects are higher than the discount rate (cost of capital/ required return) which is 10% (IRRA > 10%, IRRB > 10%).
IRRB > IRRA (the IRR of Project B, 19.8%, is higher than the IRR of Project A, 15.4%.)
Project B will be selected because it results in the higher IRR of the two projects and its IRR is higher than the required rate of return (19.8% > 10%).
COMPARING NPV AND IRR TECHNIQUES
You must be able to compare the results when using the NPV and IRR techniques.
You must be able to explain and discuss why the two techniques may deliver conflicting rankings of projects.
You must also be able to explain which technique is superior when applied to capital budgeting and supply reasons for your arguments.
ADDITIONAL SOURCES TO ACCESS FMA 101
Access the following websites to broaden your understanding of capital budgeting techniques in the context of financial management:
- Capital budgeting techniques: https://www.edupristine.com/blog/capital- budgeting-techniques, accessed 3 March 2020.
- Financial appraisal of investment projects: http://www.yourarticlelibrary.com/project-management/appraisal-of-the- projects-9-financial-techniques/94840, accessed 3 March 2020.
- Pros and cons of different capital budgeting techniques: https://prezi.com/rbrbxs_sh46r/pros-and-cons-of-each-capital-budgeting- method/, accessed 3 March
- Capital budgeting: https://www.wallstreetmojo.com/capital-budgeting- process/, accessed 3 March
FMA 101 SELF-ASSESSMENT EXERCISES
At the end of this chapter, there is a series of different self-test problems, warm- up exercises, problems and a more comprehensive case study. You should attempt to answer these questions, perform the calculations and use them to practise and re-enforce your learning and understanding. You may submit any of your answers to the lecturer for assessment and feedback.
SBS also shares copies of previous exam papers with you during the semester. The questions in these exam papers are very good examples of what you are expected to know and be able to do having studied and mastered the content of chapter 10 of the prescribed textbook and having followed the guidance provided in this topic.