BMG855 Operations Management Individual Coursework – The Paramount Diner
Stuck with your BMG855 Operations Management Case Study Assessment? At Assignment Help AUS, we guarantee 100% plagiarism-free and unique Online Assignment Writing Help from our qualified experts. Most of the students make contact with us for Dissertation Writing Service, Case Study Help, Online Essay Writing Help and more. Visit our site now and get assistance from our customer care executives 24×7.

Assessment Details:-
- Topic :: Operations Management
- Code :: BMG855
- Words :: 4000
Individual Coursework
The Paramount Diner
The case describes the Paramount: a 44-seat diner in the Beacon Hill neighbourhood of Boston, Massachusetts. The restaurant is a popular favourite among locals and tourists particularly for brunch on weekends, when queues can stretch down the street. The case study focuses on the restaurant’s unusual seating policy and a recent increase in the popularity of carryout orders.
The purpose of this case study are threefold: firstly, to provide students the opportunity to practice basic process analysis concepts, such as cycle time, throughput time, input rates, output rates, bottlenecks and utilization; secondly, for students to consider the analytical and psychological dynamics of queues and operational transparency; and thirdly, to enable students to consider the interrelationships between the design of an operation and the corresponding behaviours of customers and employees.
The assignment requires students to complete the following five questions.
1. Essay on Theory of Swift Even Flow (30%)
Students should read appropriate material regarding the importance of managing flow and productivity. The key theory to investigate is TSEF (Theory of Swift Even Flow). A list of books and articles* have been suggested to get you started. Students should also perform key word searches to supplement the directed reading. The objective of this scholarship is to help students to critically evaluate operations management relative to traditional management.
Suggested Key Words
swift even flow – productivity – services – manufacturing – healthcare – patient flow – operations management
You may want to combine a couple of these key words in your search using AND e.g. swift even flow AND productivity (1,000-1500 words)
* Schmenner, R. W. (2012) Getting and Staying Productive, Applying Swift Even Flow to Practice, Cambridge, UK, Cambridge University Press
* Schmenner, R.W., 2004. Service businesses and productivity. Decision Sciences, 35(3), pp.333-347
* Schmenner, R.W. and Swink, M.L., 1998. On theory in operations management. Journal of operations management, 17(1), pp.97-113
* Fredendall, L.D., Craig, J.B., Fowler, P.J. and Damali, U., 2009. Barriers to swift, even flow in the internal supply chain of perioperative surgical services department: a case study. Decision Sciences, 40(2), pp.327-349
*Devaraj, S., Ow, T.T. and Kohli, R., 2013. Examining the impact of information technology and patient flow on healthcare performance: A Theory of Swift and Even Flow (TSEF) perspective. Journal of Operations Management, 31(4), pp.181-192.
2. Process Analysis (20%)
- Following the guidelines provided below*, conduct a quantitative analysis of the restaurant operation to identify the bottleneck in the process and to calculate how long customers might have to wait to be served.
- Explain how the unusual seating policy is an operations management tool.
(300-500 words)
Cycle Times, Bottleneck Identification & Flow Rate
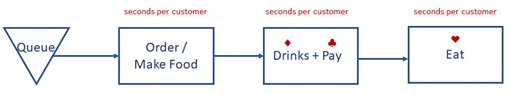
Figure 1: Process Flow Diagram for the Paramount
* Using the Process Flow Diagram in Figure 1 and the information on page 3 of the case, you should calculate the processing time for each of the three steps in seconds per customer
♦ Note that there are two employees fulfilling drinks; you are told how many seconds that one employee can fulfila drinks order.
♣ Note that there are 2.6 customers per party; you are told how many seconds that the one employee taking payments can process per party. You’ll have to convert this to per customer.
♥You are told on page 3 how long in minutes that every table turns over.
You need to convert this table turnovertime to seconds and then divide by the number of seats in the restaurant to calculate the seconds per customer. However, you should assume only 80% of the seats are occupied by customers at any time. Therefore, make sure to multiply the seat number by 0.8 before completing the calculation.
- You should now be able to identify the bottleneck step in seconds per customer; this is the cycle time of the process.
To convert cycle time into the Flow Rate that customers flow through the restaurant, use the formula 1 / cycle-time. This will tell you how many customers per second are processed. Remember to multiply this by 3600 to convert the Flow Rate units into customers per hour.ThisFlow Ratein customers per hour can be used as the value of (service rate) for the equations in Exhibit 8 of the case study.
Customer Arrival Rates
Waiting time formulae are provided in Exhibit 8 of the case study.
UseExhibit 6 to analyse the rate per hour that customers arrive. You should focus on the Saturday data as this is the restaurant’s busiest day. To start you off: between 7:30am and 8:30am, 35+45 = 80 customers arrive. You can calculate the number of customers per hour for each of the hours up to 1:30pm.
Use Exhibit 7on Customer Balking and Reneging to adjust your customer arrival rates. To start you off: between 7:30am and 8:30am, 15 customers either balk or renege. This means that between 7:30am and 8:30am, 80 customers arriving – 15 customers balking or reneging = a net 65 customers per hour arriving.You can similarly adjust your calculations above for each of the hours up to 1:30pm. You could use a table like that in Table 1 below.
Table 1:Customers per hour arriving on Saturday
| Hour Slot | Number of customers arriving per hour from Exhibit 6 | Number of customers balking or reneging per hour from Exhibit 7 | Net number of customers arriving per hour | Adjust to nearest whole number
e.g. 72 goes to 70 e.g. 77 goes to 80 etc. |
| 7:30am – 8:30am | 35 + 45 = 80 | 15 | 65 | 65 |
| 8:30am – 9:30am | 35 + 42 = 77 | 4 + 12 = 16 | 61 | 60 |
| 9:30am – 10:30am | ||||
| 10:30am – 11:30am | ||||
| 11:30am – 12:30pm | ||||
| 12:30pm – 1:30pm |
Once you have completed a similar table for yourselves, choose the highest net customers arriving per hour value◊ (Table 1, column 5) for the calculations below.
◊ This value can be used as the value of (customer arrival rate) for the equations in Exhibit 8 of the case study.
Worker Utilization
The Utilization equation is given in Exhibit 8 of the case study: ρ= γ/μ
You can calculate Worker Utilization as you have already worked out and above.
Average Number of Customers Waiting for the Restaurant in a Queue
The equation for the average number of customers waiting for service (waiting in a queue) is given in Exhibit 8 of the case study: Lq=ρ2/(1 – ρ)
- Once you have calculated Lq, multiply this by 1.5 minutes per customer (based on 90 customers per hour) to calculate how many minutes the wait will be for each customer.
- We are told on page 2 of the case study that the restaurant opens on a Saturday at 8:00am. Exhibit 6 tells us that there are 35 customers in the queue on a Saturday morning before the restaurant opens. Therefore, you need to add this 35 to the Lq value above and multiply this by 1.5 minutes per customer (based on 90 customers per hour) to calculate how many minutes the wait really will be for each customer on a Saturday.
Restaurant Customer Queue Length when Carryout Orders are Being Processed
If the Paramount can process 90 customers per hour, let’s assume that Michael Conlon allows 10% of the customer orders to be carryout orders. This would mean that 9 customer orders per hour were for carryout food and 81 customers per hour could be processed in the restaurant.
- Use 81 as the value of (service rate) and recalculate worker utilization
- Use this new value of to recalculate the number of customers waiting in the queueLq
This will give you a good insight into the impact that accepting more carryout orders would have on queues at the restaurant.
3. Read the two articles referenced below*** which describe how customers in service industries introduce variability. (15%)
- Use the knowledge acquired to discuss how customers introduce variability for the Paramount
- Discuss whether the Paramount accommodates or reduces this type of variability.
(750-1000 words [a) & b)]
(Reducing variability reduces operating costs, but often at the expense of customer satisfaction; accommodating variability enhances satisfaction at the expense of operating costs)
***Sasser, W. E. (1976) “Match supply and demand in service industries”, Harvard Business Review, Nov-Dec, pp. 133-140
*** Frei, F. X. (2006) “Breaking the trade-off between efficiency and service”, Harvard Business Review, Nov, pp. 92-101
4. Using the information from the case study and knowledge acquired from the calculations performed in part 1), students should consider the issue of carryout orders. (15%)
Your discussion should consider the following issues:
- Where has the idea for carryout orders come from?
- What are the business motivations for adding this type of service?
- What impact will adding this service have on the restaurant customer experience?
(750-1000 words [a), b) & c)]
5. Management Decision. (10%)
Advise the owner, Michael Conlon, as to the best course of action to take. You should choose between more carryout orders or less carryout orders. There are several reasons why you could justify either of these choices so your answer should describe what these might be****.
(300-500 words)
****What factors would tempt Michael Conlon to increase carryout orders?
****What factors would tempt Michael Conlon to decrease carryout orders?
It is expected that the overall written coursework will not exceed 4,000 words.
All published information that has been used in the preparation of the written assignment report should be properly referenced.
Mark Breakdown
- Marks for the quantitative analysis will be awarded for the computations and the working out.
- Marks for the other sections will be awarded on the strength of the arguments; these will depend on the quality of your reading of the case, the use of the calculations performed and use of the directed reading references. You are not expected to find your own references
- The breakdown of marks is as follows:
- (1) Theory of Swift Even Flow 30%
- (2) Capacity & waiting time analysis 20%
- (3) Customer induced variability 15%
- (4) Carryout orders analysis 15%
- (5) management decision 10%
- Scholarship& presentation 10%
Total 100%
The written report is to be submitted via Turnitin
FOR REF… USE #getanswers2001529