BUS 230 Economic Statistics – Practical Questions
Are you looking for BUS 230 Economic Statistics Assessment Question and Answers? If yes, then there is no better place than AssignmentHelpAUS for you all. We guarantee 100% plagiarism free work with the help of our 100+ expert writers. We provide various kinds of services like Assignment Writing Help, CDR Skill Assessment, MBA Assignment Help, and so on. Contact us now and get the best quality work from our expert team.

Assignment Details:-
- Course Code: BUS 230
- Course Title: Statistics
- Referencing Styles: APA
- Words: 9999+
- University: Camosun College
- Country: CA
Questions:-
Question1.
A sample of high school students was asked the following question: how much time (measured in minutes) do you spend on TikTok per day? The results of the survey are shown below.
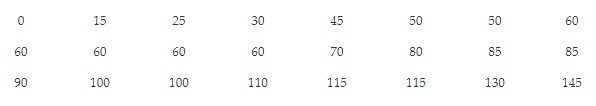
- Using the 2k > n rule, how many classes are required when organizing this information into a frequency distribution?
- Based on your solution in part (a), what interval size would you recommend?
- Based on your solution in part (a) and (b), organize this information into a frequency distribution, relative frequency distribution, and cumulative frequency distribution.
Question2.
The information listed below represents a sample of waiting times (measured in minutes) for The Rattler waterslide at Cultus Lake Waterpark.

- Using the BAII Plus (or Excel), calculate the mean.
- Using the BAII Plus (or Excel), calculate the standard deviation.
- Calculate the median.
- Calculate and interpret Pearson’s Coefficient of Skewness.
Question3.
A sample of college students revealed the following information about their time spent watching Netflix: = 8 hours per week; and, s = 2 hours per week.
Using Chebyshev’s Theorem, find the minimum proportion of college students who spend between 4.5 and 11.5 hours per week watching Netflix. (5 marks)